Know what an indicator measures
RSI summarizes recent price momentum; it does not estimate fundamental value. Fidelity’s RSI guide notes that ‘overbought’ readings can persist during trends. Our expanded RSI primer covers timeframes, false signals and independent testing.
A good backtest can still mislead
A process chosen after inspecting successful historical charts may be overfit. Write rules before evaluation, preserve untouched later periods, and include spread, slippage, commissions and missed fills.
Follow the evidence
Use support and resistance and moving averages as hypotheses rather than trading instructions. Maintain a research journal and revise conclusions when actual results contradict the model.

Setups
A breakout describes price moving beyond a previously observed range.
16 October 2026 · 6 min read

Price action
Price action refers to interpreting market behavior from observed prices, ranges and structure, sometimes without conventional indicators.
16 October 2026 · 6 min read
Indicators
Average True Range (ATR) is a measure of observed trading range.
16 October 2026 · 6 min read
Price action
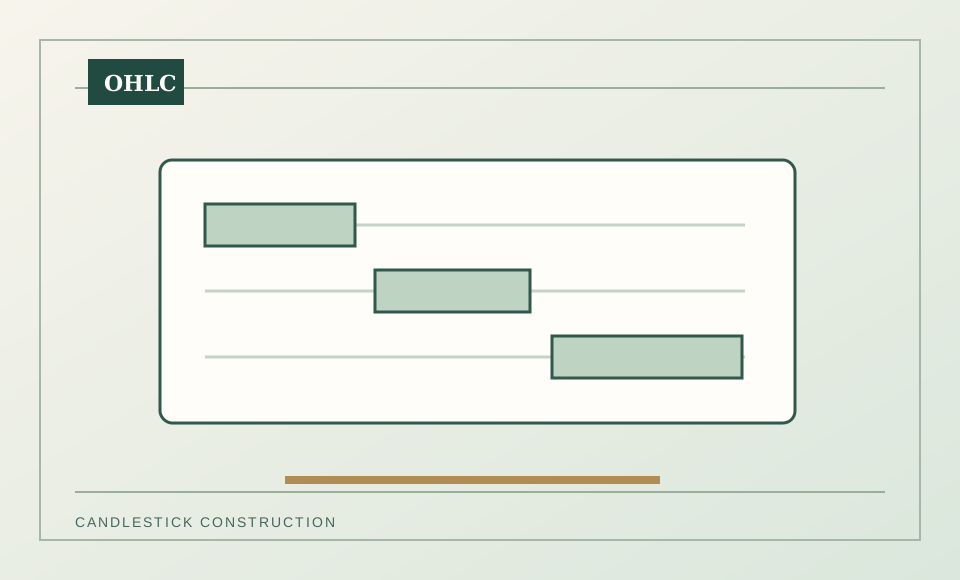
Candlesticks summarize open, high, low and close for one interval.
16 October 2026 · 6 min read
Indicators
Moving averages smooth noisy price data, making persistent direction easier to see while necessarily reacting after the underlying move has begun.
16 October 2026 · 6 min read
Momentum and indicators
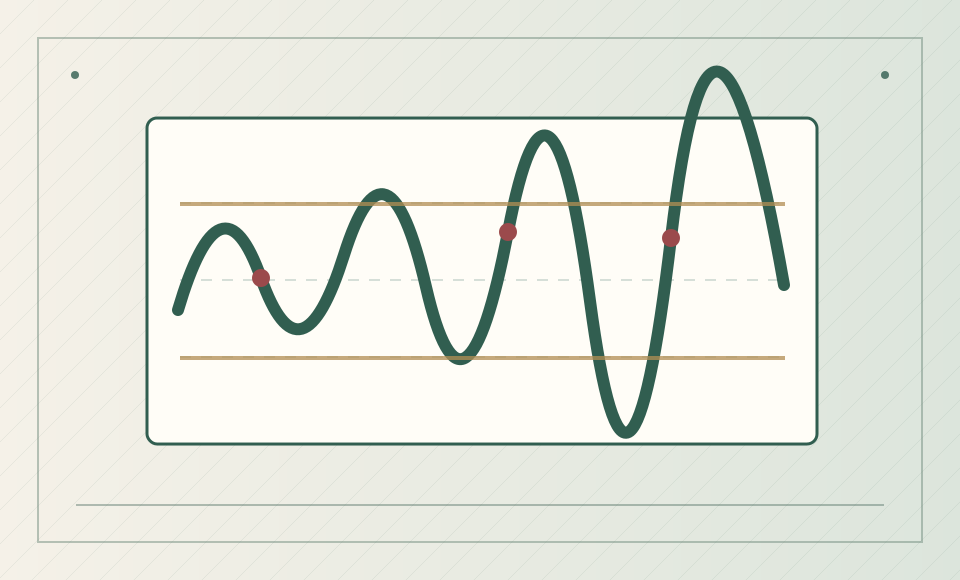
The RSI can stay above 70 through a strong trend. Treat a threshold as a description of momentum, not a guaranteed reversal.
16 October 2026 · 7 min read
Chart analysis
Support and resistance are areas where participants have previously interacted with a price, not invisible walls that compel future reversals.
16 October 2026 · 6 min read