Average True Range (ATR) is a measure of observed trading range. It can help standardize a discussion of volatility while saying nothing about whether the next move will be up or down.
The underlying mechanism
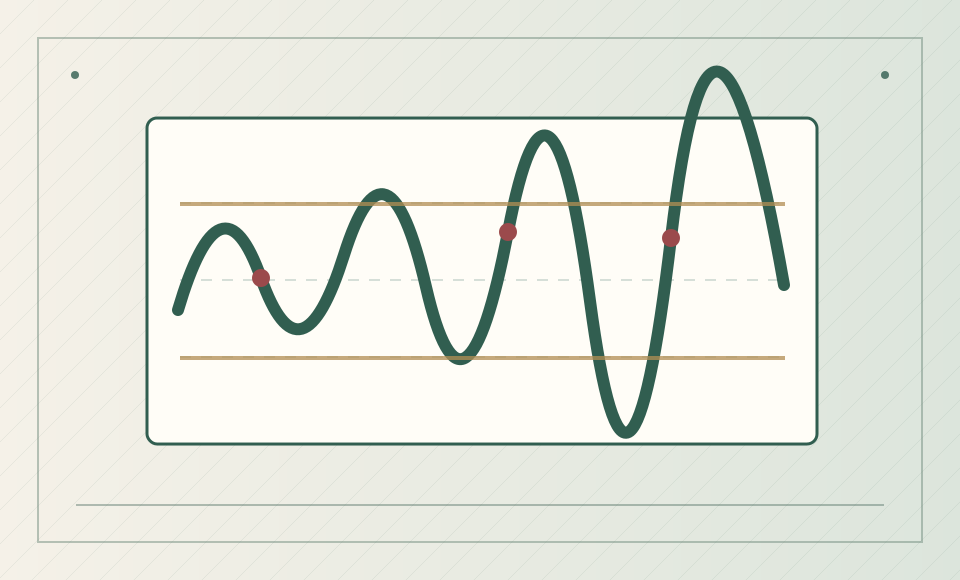
True range considers the current high-low range and gaps relative to the prior close. ATR smooths those values across a lookback period. Its unit is the instrument’s price unit, so direct comparisons across differently priced assets need normalization.
Average true range (ATR) summarizes the typical magnitude of recent price movement, accounting for each interval’s high–low range and gaps relative to the previous close. It is a volatility measure in price units, not a probability model for which direction the next bar will travel.
How to evaluate it in practice
Use ATR to frame the scale of normal movement or to evaluate whether a proposed stop is unusually narrow for prevailing conditions. Consider sudden regime shifts and the fact that past volatility is a backward-looking statistic.
Compare ATR only with explicit context: the instrument, timeframe, lookback and quote units. An ATR of 1.2 means something very different for a stock trading at USD 20 and for a bond future. Normalize by price where cross-instrument comparisons are genuinely useful, and test historical distributions.
Common mistakes and limits
An ATR-based stop is not a guarantee of the maximum realized loss. Gaps, slippage and order execution rules can produce exits beyond the intended threshold.
A stop positioned at one ATR does not guarantee the maximum loss. The SEC’s stop-order bulletin explains why trigger and fill prices may diverge. ATR describes movement magnitude, not executable liquidity.
An exercise for careful readers
Compare the same fixed-price stop with a volatility-scaled stop during calm and volatile historical windows. Describe costs and possible overshoot.
Calculate ATR for a defined sample, separately note news-event bars, then test how often a hypothetical movement threshold was exceeded out of sample. Report the exceptions and transaction costs rather than selecting an attractive chart.
Continue your research
Explore the related topic hub, the risk warning and our editorial standards for additional context. External primary-source references appear below this article.